Analysis of the trajectory of COP and extraction of the diagnostic parameter CPEI to diagnose foot functional disorders (2)
Accurate assessment of foot biomechanical disorders is very important in designing a suitable orthosis for treatment. Due to the availability of accurate diagnostic tools, including all types of foot scanner devices, two and three dimensional foot scanners, foot pressure analysis platforms in static and dynamic states, as well as the existence of specialized software in designing and manufacturing special orthoses CAD/CAM, today, attention is directed towards increasing accuracy in diagnosing the origin of disorders and more precise design of corrective orthoses.
This article is the second of the educational materials published by the Aramed Academy department, to acquaint medical centers active in the field of foot health with the information available in foot pressure distribution contours in foot scan devices, and how to interpret and exploit it in achieving The best diagnosis and design of insoles or sandals is therapy.
In the previous article, the importance of COP or the foot pressure center and how to identify its course was introduced. As mentioned in the mentioned article, the COP curve can be extracted in dynamic foot scanner devices or dynamic foot pressure analysis platforms, and it can be used depending on the working frequency, the accuracy of the sensors and the number of sensors in the foot scanner device. be In this article, we examine the CPEI parameter (Center of Pressure Excursion Index), as a diagnostic index extracted from the COP curve in dynamic foot scanner devices.
The purpose of extracting the CPEI parameter is to investigate the functional status of the foot more closely, in terms of deviations and disorders related to over-pronation or under-pronation. For this purpose, we first define these two pathological parameters.
Pronation or inverted foot
The term foot pronation, which is sometimes used as the Persian equivalent of internal rotation, includes a natural movement of the foot, which after the heel strike phase is completed, prevents the transfer of shock stresses to other parts of the body’s musculoskeletal system. provides In the available scientific articles and sources, the internal rotation movement of the foot is divided into three joint movements in three planes, including subtalar eversion, ankle dorsiflexion and forefoot abduction.
In the stance phase, which begins with heel strike, the outer edge of the heel comes into contact with the ground. This contact creates a locked state in the movement mechanism of the body. In the continuation of this phase and before reaching the foot load, the body is either forced to accept the shock from the ground surface, or by creating an internal turning state, as seen in the figure below, while absorbing the shock caused by this contact. , makes it possible to continue moving smoothly and without shock. This movement is the natural pronation or internal rotation of the foot, which makes the distribution of force on the surface of the foot to remain normal and uniform, along with a smooth and shock-free movement.
By increasing the amount of outward rotation of the foot, we will see over-pronation in the foot. In this case, due to the deviation created at the end of the heel strike phase, the foot suffers complications from shock transmission and joint and muscle pains, and the power transmission to the end of the stance phase takes an unusual path. As it is often seen in the toe-off phase, the majority of the force transmitted from metatassophalangeal joints one and two is tolerated, and when the pressure distribution deviates from the normal state, it will result in the concentration of tension and pain in the foot.
On the other hand, by reducing the amount of pronation from its normal amount, the foot is under-pronation, which is also referred to as supination. In this case, the shock caused by the initial impact of the heel remains and is transferred to the lower parts of the skeletal chain. In this case, in contrast to the over-pronation state, we see the transfer of the majority of the force from the fifth metatarsophalangeal side, and stress concentration in the lateral part of the anterior part of the foot.
Flat or inverted foot?
One of the interesting points in the published materials about foot disorders is the common mistake of equating flat feet with inverted feet. In the same way, it can be seen in some of the materials published on the Internet that sometimes under-pronation in the foot is equated with the Dicey arch foot disorder. This is despite the fact that, according to valid scientific articles, problems such as flat feet or Dicey’s arch are classified in the category of structural problems, and pronation or supine state are classified in the category of functional problems of the foot. Although the separation of these two categories of biomechanical forms does not mean that they are unrelated. In the following articles, we will discuss the differences between these two disorders in more detail and diagnose them using foot scanners and pressure analysis platforms.
CPEI index in foot pronation study
One of the important parameters that can be extracted from the COP curve is the CPEI index. This index, as shown in the figure below, indicates the amount of lateral deviation of the COP curve in the front third of the leg, compared to the line connecting the beginning and end points of the COP curve. To calculate the CPEI, the aggregate frame related to the entire stance phase in the data extracted from a dynamic foot scanner is analyzed and divided into three parts according to the figure. The construction line is drawn from the first starting point of the COP curve to its end point according to the image below. The AD line separates the front third from the middle third of the foot print surface. The distance between the intersection of the AD line and the Construction line, i.e. point B, as well as the intersection of the AD line and the COP curve, i.e. point C, are calculated. In this way, the value of the CPEI parameter is obtained from the result of dividing CPEI=BC/AD.
_
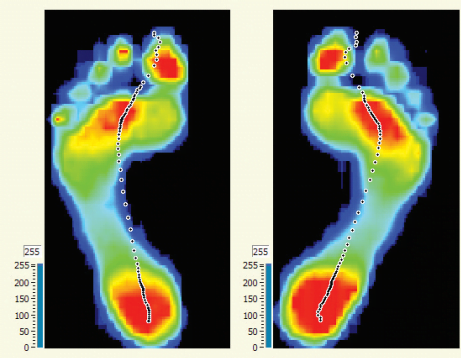
In a leg suffering from over-pronation disorder, the convexity of the COP trajectory is reduced and this curve is inclined to a straight line. Naturally, in this case, the value of the CPEI parameter decreases and even becomes negative. Meanwhile, in a foot suffering from under-pronation, the convexity of the COP curve is abnormally increased and this will increase the CEPI. In the images shown in the figure below, the paths of the COP trajectory and the diagnostic parameters regarding the functional status of the foot are displayed from the point of view of the CEPI index.
_
The studies conducted on CEPI values have led to the presentation of pathological borderline values in the diagnosis of the above deviations, the results of which can be seen in the table below. The investigations have shown a significant relationship between the deviation from the anatomical numbers and the occurrence of low back pain in these people.
_
In the following content, more details about the points in the output contours of foot scanner devices, differentiation of structural and functional disorders of the foot, diagnostic indicators related to the foot, the effect of each factor in the design of suitable insoles or sandal therapy, software settings And we will also pay attention to the expectations of a proper foot scanner. It is hoped that with the publication of these materials by Aramed Academy, the field of improving public knowledge in the field of diagnosis and treatment of biomechanical foot disorders in technical orthopedic centers and other specialized centers active in the field of foot health will be provided.